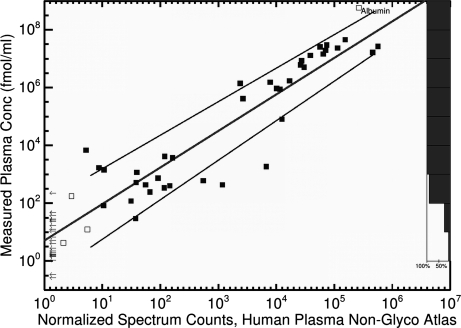
Fig. 3.
Plasma protein concentrations determined using immunoassay and antibody microarray analysis (40) versus normalized spectral counts from the Human Plasma Non-glyco PeptideAtlas, plotted on a log scale. Each small square represents a protein found in both sources. Hollow squares represent proteins that were excluded when drawing the trend line (either depleted (albumin) or fewer than four spectrum counts). The line segments above and below the trend line are fit to the standard deviation of the y axis values computed at intervals of 0.1 (log scale). The arrows on the left represent proteins with reported concentrations in (40) but no spectrum counts. The histogram at the right depicts an estimate of the completeness of the Human Plasma Non-glyco PeptideAtlas as a function of concentration, calculated as the number of points divided by the total number of points and arrows within each decade. See supplemental Fig. S2, for N-Glyco atlas.

