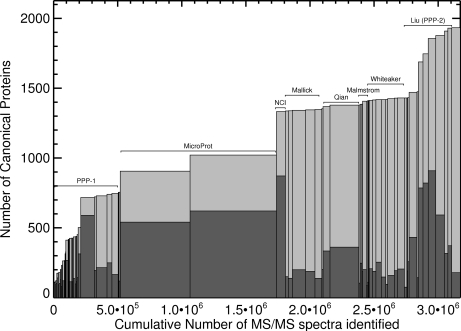
Fig. 4.
Proteins identified by each experiment. Each bar represents one of the 91 experiments, ordered as in supplemental Table S4. Height of dark bar = canonical protein sequences identified per experiment; total height (dark + light) = cumulative tally; width of bar = PSM count. See supplemental Fig. S5, for a similar graph of distinct peptides.

