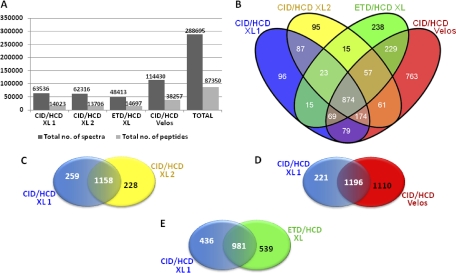
Fig. 2.
A, The table shows the total number of spectra recorded from each sample as well as the total number of peptides assigned by database searching. B, A total of 2832 unique proteins were identified in this study. This Venn diagram illustrates the distribution of the proteins among the four different experiments. The number of proteins unique as well as shared among different experimental setups. C, CID/HCD versus CID/HCD on a LTQ-orbitrap XL, D, CID/HCD on a LTQ-orbitrap XL versus CID/HCD on a LTQ-orbitrap Velos, and E, CID/HCD versus ETD/HCD on a LTQ-orbitrap XL.

