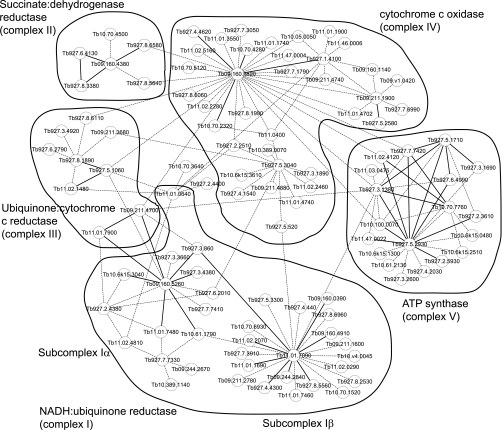
Fig. 7.
Predicted protein-protein interaction network of the T. brucei respiratome. This Cytoscape graphical representation shows probable interactions within each respiratory complexes I-V and within the respiratome. The bold line indicates high confidence potential direct-interaction between the indicated proteins, and dotted line indicates additional proteins that were pulled-down by the bait.

