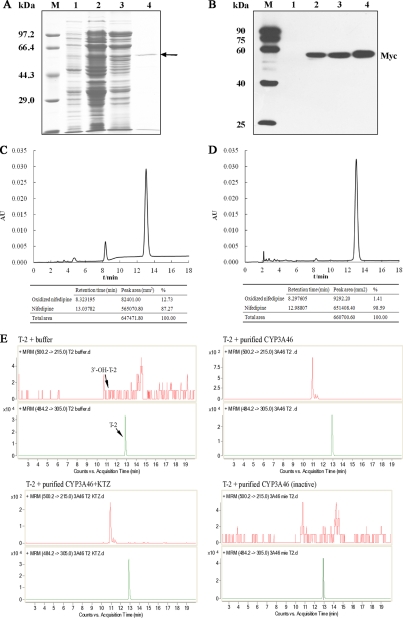
Fig. 6.
T-2 metabolism of purified CYP3A46. The prokaryotic expression and purified proteins were analyzed by 10% SDS-PAGE gels with Coomassie blue staining (A) and Western blotting using anti-myc antibodies (B). Lane 1: non-IPTG induced total cell lysates; lane 2: IPTG induced total cell lysates; lane 3: solubilized membrane fraction; lane 4: FPLC purified protein. The bioactivities of purified CYP3A46 were tested by incubating CYP3A46 with nifedipine (C) or nifedipine and ketoconazole (D). HPLC was used to detect nifedipine and its metabolite. E, Purified CYP3A46 was further incubated with T-2, and then the products were analyzed by LC-ESI-MS/MS. The detection was accomplished by MRM with the transitions m/z 484.2/305.0 for T-2, and m/z 500.2/215.0 for 3′-hydroxy-T-2.

