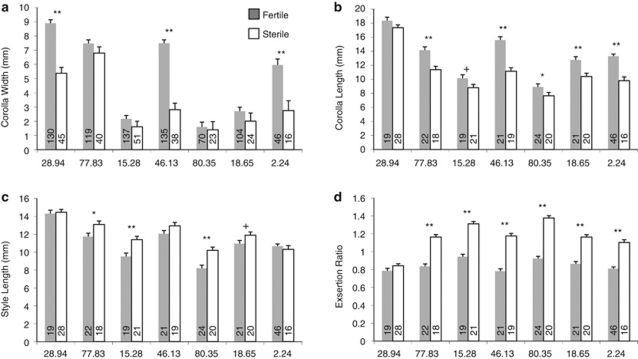
Figure 4.
Least squares means (+1 s.e.) of the family × sterility interaction from the analysis of variance of floral traits (a) corolla width, (b) corolla length, (c) style length and (d) stylar exsertion (corolla length/style length ratio). Sample sizes per family in each sterility class are at bottom of bars. +P<0.10, *P<0.05, **P<0.01 in comparisons of LSMs within family.

