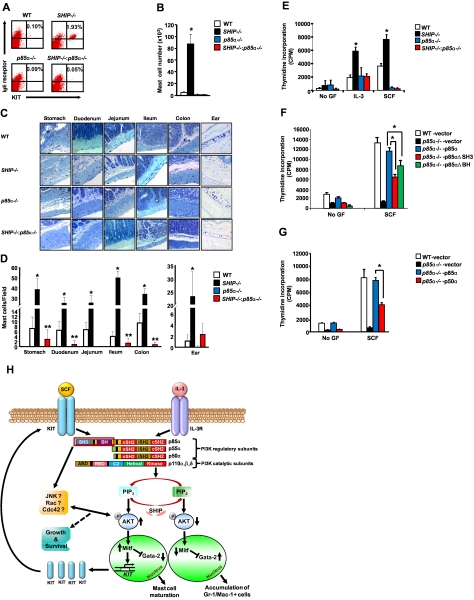
Figure 7.
Deficiency of p85α in SHIP−/− bone marrow cells rescues the increase in mast cell numbers in vivo in various tissues. Wsh mice lacking mast cells were lethally irradiated and transplanted with 1 million bone marrow cells derived from WT, SHIP−/−, p85α−/−, and SHIP−/−:p85α−/− mice. Four months later, cells from the peritoneal cavity or the indicated tissues of recipient Wsh mice were harvested and stained with antibodies against KIT and IgE receptor or embedded tissue sections were stained with toluidine blue. (A) Representative dot blots indicate peritoneal cavity-derived mast cells stained with an anti-KIT and anti-IgE receptor antibody from the indicated genotypes. Numbers in the top right quadrant of dot blot indicate the percentage of peritoneal cells that were double positive for KIT and IgE receptor expression. (B) Bar graph represents quantitative assessment of the total number of mast cells in 5 mL of peritoneal lavage of Wsh mice transplanted with BM cells from the indicated genotypes. n = 5 (mean ± SEM), *P < .05, WT versus SHIP−/−. (C) Representative photomicrographs of toludine blue-stained tissue sections derived from Wsh mice transplanted with BM cells from the indicated genotypes. (D) Bar graph indicating quantitative assessment of toludine blue-positive mast cells in the indicated tissues. n = 3 ∼ 5 (mean ± SEM). *P < .05, WT versus SHIP−/−. **P < .05, WT versus SHIP−/−:p85α−/−. (E) BMMCs from the indicated genotypes were starved for 6 hours and cultured in the presence or absence of SCF or IL-3. After 48 hours, proliferation was evaluated by [3H]thymidine incorporation. Bar represents the mean [3H]thymidine incorporation in BMMCs (cpm ± SD) from 1 representative experiment performed in quadruplicate. Similar results were obtained in 3 independent experiments. *P < .05, WT versus SHIP−/−. (F-G) Overexpression of p50α or N-terminal deletion mutants of p85α partially correct the defective growth of p85α−/− BMMCs. p85α-deficient BMMCs expressing the indicated versions of p85α were starved of growth factors and stimulated with SCF. After 48 hours, proliferation was evaluated by [3H]thymidine incorporation. Bars represent the mean [3H]thymidine incorporation (cpm ± SD). Shown are data from one of many independent experiments. *P < .05, p85α−/− -p85α versus p85α−/− -p50α or p85α−/− -p85αΔSH3 or p85α−/− -p85αΔBH. (H) A model describing the mechanisms involved in regulating growth and maturation of mast cells via the PI3K pathway (see “Discussion” for details).

