Figure 1.
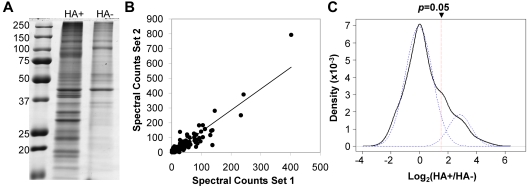
Analysis of ABE-purified palmitoylated proteins from platelet membranes. (A) Electrophoretic analysis. Lane 1 indicates molecular weight marker; lane 2, experimental samples (HA+) with hydroxylamine treatment; and lane 3, control samples (HA−) without hydroxylamine treatment. (B) The correlation between proteins identified in 2 separate rounds of spectral counting analysis. Data were fit with a linear function (R2 = 0.8645). (C) Distribution of log(HA+/HA−) ratios. Bayesian Information Criterion-based Gaussian Mixture modeling suggested that the distribution of log-ratios (solid line) is composed of 2 Guassian components (dashed line). The left Gaussian represents the log-ratio distribution of most contaminating proteins and some palmitoyl proteins, whereas the right Guassian represents the log-ratio distribution of most palmitoyl proteins and a small number of contaminants. To distinguish palmitoyl proteins from contaminating proteins, P values were calculated based on the distribution of the left Gaussian. Proteins with P < .05 were treated as significant and accepted as palmitoyl protein candidates.

