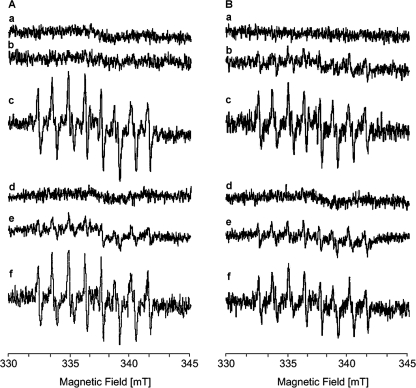
FIGURE 5.
NAD(P)H-induced superoxide production by complex I (A) and the E183HF variant (B). The spectra were recorded with aliquots of the proteins reconstituted with phospholipids in the presence of 100 mm DEPMPO and 100 μm decyl-ubiquinone (trace a), plus 1 mm NADH (trace b), plus 1 mm NADPH (trace c), plus 1 mm NADPH and superoxide dismutase (100 units/ml) (trace d), plus 1 mm NADPH but without decyl-ubiquinone (trace e), and plus 1 mm NADPH and 20 μm piericidin A (trace f). Other EPR conditions were as follows: microwave frequency, 9.65 GHz; modulation amplitude, 0.1 mT; time constant: 0.164 s; scan rate: 5.4 mT/min.

