FIGURE 5.
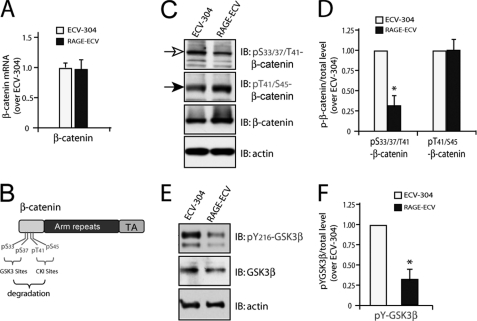
Decrease of GSK3β-mediated β-catenin phosphorylation in RAGE-ECV cells. A, real-time PCR analysis of β-catenin transcript level in ECV-304 and RAGE-ECV cells. RNAs, isolated from indicated cells, were used for the synthesis of cDNAs and real-time PCR analysis. Data were normalized by internal control of GAPDH and presented as -fold over the ECV-304 control (mean ± S.D. (error bars), n = 3). B, illustration of β-catenin phosphorylation sites that induce its degradation. C, Western blot analysis of β-catenin phosphorylation using the indicated antibodies. D, quantification analysis of the relative β-catenin phosphorylation level. Means ± S.D. (n = 3) are presented. *, p < 0.01, significant difference from the ECV-304 control. E, Western blot analysis of GSK3β tyrosine 216 phosphorylation using the indicated antibodies. F, quantification analysis of the relative GSK3β tyrosine phosphorylation level. Means ± S.D. (n = 3) are presented. *, p < 0.01, significant difference from the ECV-304 control. IB, immunoblot.

