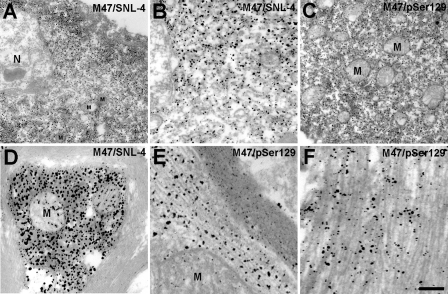
FIGURE 7.
Ultrastructural analyses of α-syn inclusions in E46K α-syn transgenic mouse. Immmunoelectron microscopy analysis was performed in the pons of a 16-month-old symptomatic E46K α-syn transgenic mouse with antibodies SNL-4 (A, B, and D) or pSer129 (C, D, and F). A and B, progressively increased magnification of an α-syn inclusion within a neuronal cell body. The inclusion demonstrates trapped mitochondria and the fibrillar profile of α-syn inclusions. C and D, intensely labeled α-syn inclusion in a cell body (C) or axon with numerous trapped mitochondria. E and F, higher magnification of more lightly labeled anti-α-syn inclusions, allowing observation of the clear fibrillar profile of α-syn inclusions. N, nucleus; M, mitochondria. Scale bar, 660 nm (A and C), 266 nm (B), 200 nm (D), and 133 nm (E and F).

