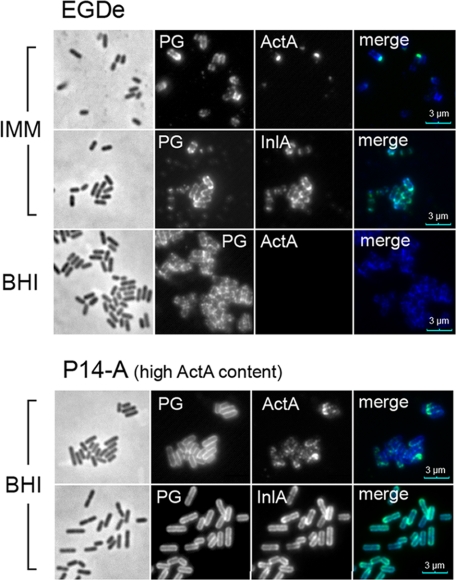
FIGURE 8.
ActA exposure in bacterial cell surface to the amount of ActA protein present in the membrane. L. monocytogenes P14-A (ActA-overproducing strain) and EGDe (wild-type) were grown to stationary phase in BHI or minimal medium IMM, fixed in 3% paraformaldehyde, and processed for immunofluorescence microscopy. Monoclonal mouse antibodies anti-InlA, anti-ActA, and a polyclonal rabbit antibody raised against proteins strongly bound to peptidoglycan (PG) were used. As secondary antibodies, goat anti-mouse Alexa-488 (green) and goat anti-rabbit Alexa-594 (red) were used. The red fluorescence was pseudo-colored to blue to better differentiate the two labels in the overlay image. Note that ActA is clearly visible on the surface of the overproducing strain P14-A, although it is visible at the poles of EGDe bacteria grown in minimal medium IMM. No ActA was detected in EGDe bacteria grown in BHI. The surface distribution of the LPXTG protein InlA is shown for comparison. Scale bar, 3 μm.

