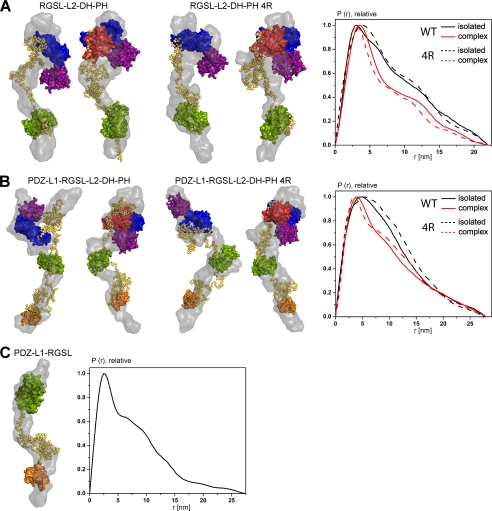
FIGURE 5.
Rigid body and ab initio models of PRG variants. A, RGSL-L2-DH-PH. B, PDZ-L1-RGSL-L2-DH-PH. C, PDZ-L1-RGSL. The left panels in A and B show models of the wild-type PRG +/− RhoA, and the center panels show models of the 4R mutant of PRG +/− RhoA. The right panel shows distance distribution function, P(r), of the wild-type and 4R mutant of PRG variants in isolation (solid and dashed black line, respectively) and RhoA complexes (solid and dashed red line, respectively). Ab initio models and folded domains of PRG and RhoA are depicted in surface representation (gray, ab initio; orange, PDZ; green, RGSL; blue, DH; purple, PH; red, RhoA), and linker regions are represented as yellow spheres.

