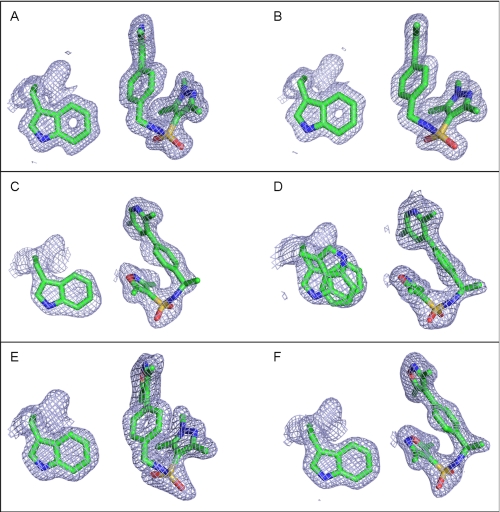
FIGURE 3.
Shown are the 2Fo − DFc OMIT electron density maps around the ligand and Trp755 in monomers A and B for each of the three complexes shown at 1. 0 σ. Trp755 is included as three-dimensional reference to demonstrate that each of the ligands is shown in a comparable orientation. A is monomer A from the PR-OrgA complex, and B is monomer B from the same complex. C is monomer A from the PR-OrgB complex, and D is monomer B from the same complex. Trp755 is shown in a dual conformation for this monomer as indicated by the electron density map. E is monomer A from the PR-OrgC complex, and F is monomer B from the same complex. Images were generated using PyMOL. The ligand in monomer B is OrgC indicating a successful exchange, but the electron density indicates that monomer A still contains OrgA, indicating that exchange did not occur in this monomer.

