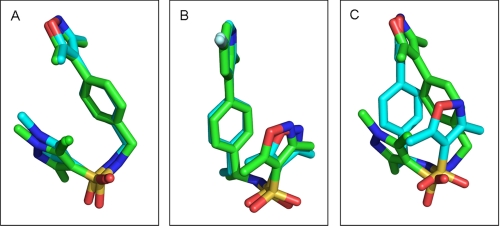
FIGURE 7.
A, overlay of OrgA from monomer A (shown with carbons colored green) and OrgA from monomer B (shown with carbons colored cyan) from x-ray structure 1. B, overlay of OrgB from monomer A (shown with carbons colored green) and OrgA from monomer B (shown with carbons colored cyan) from x-ray structure 2. C, overlay of OrgA from monomer A (shown with carbons colored green) and OrgC from monomer B (shown with carbons colored cyan) from x-ray structure 3. Images were generated in PyMOL.

