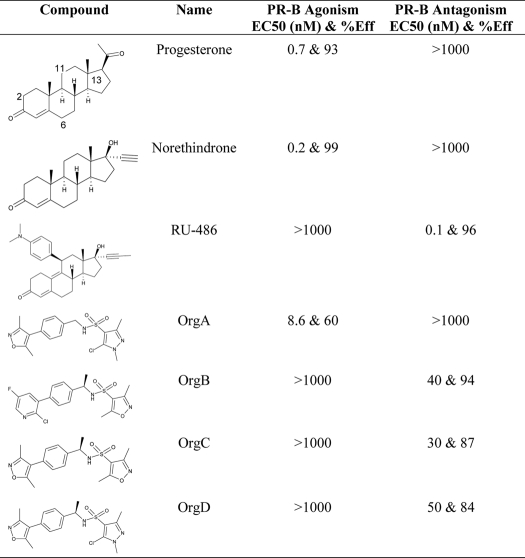
TABLE 1.
Cell-based agonism and antagonism, shown for OrgA, OrgB, and OrgC with data and structures for progesterone, norethindrone, and RU486 shown as references
Agonism and antagonism are shown as EC50 values (in nanomolar) with percentage efficacies associated. Efficacy is measured by curve height at maximal effect and expressed as percentage of reference compound effect. >1000 nm indicates no response at the highest tested concentration.

