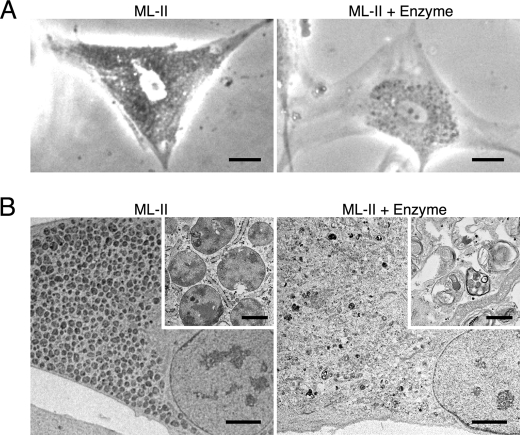
FIGURE 7.
Inclusion bodies disappear after enzyme treatment in ML-II. A, phase-contrast micrographs of ML-II and enzyme-treated ML-II cells. Scale bars, 20 μm. B, electron micrographs of ML-II and enzyme-treated ML-II cells. Scale bars, 5 μm and 500 nm (inset). Micrographs show accumulation of inclusion bodies in ML-II cells and their reduction following enzyme treatment.

