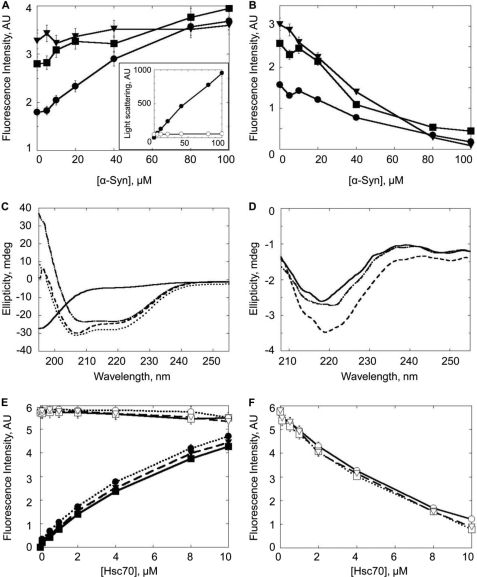
FIGURE 6.
Conformational changes within Hsc70 upon interaction with soluble α-Syn. Top panels, changes in tryptophan fluorescence (excitation 285 nm, emission 305 nm) of Hsc70 incubated for 1 h at 37 °C, in 50 mm Tris-HCl, pH 7.5, 150 mm KCl, 0.5 mm ATP, and 0.05 mm MgCl2 with increasing concentrations of soluble α-Syn. A, fluorescence intensity recorded for 5 μm Hsc70 (●), 10 μm Hsc70 (■), or 25 μm Hsc70 (▾) with increasing concentrations of α-Syn. Inset, light scattering (at 350 nm) of Hsc70 (25 μm) with increasing concentrations of α-Syn (0.1 to 100 μm) (○) and fibrillar α-Syn as a control (0 to 100 μm, ●). B, change in fluorescence intensity after subtracting the contribution of α-Syn from the overall signal in α-Syn/Hsc70 mixtures. Middle panel, far-UV circular dichroism. C, spectra of Hsc70 (25 μm, dot-dashed line), α-Syn (50 μm, solid line), and α-Syn·Hsc70 complex (dashed line). The latter spectrum clearly differs from the theoretical one (dotted line) obtained by summing the spectra of Hsc70 and α-Syn. D, difference spectra obtained upon subtracting experimental spectra for 5 (solid line), 10 (dot-dashed line), or 25 μm (dotted line) Hsc70 with 50 μm α-Syn from the calculated theoretical respective spectra. The spectra were obtained at 20 °C using a JASCO J-810 dichrograph equipped with a thermostated cell holder using a 0.1-cm path length quartz cuvette. Each spectrum was the average of 10 acquisitions recorded in the 260–195 nm range with 0.5-nm steps, a bandwidth of 2 nm, and at a speed of 100 nm min−1. Lower panel, changes in tryptophan fluorescence (excitation 285 nm, emission 305 nm) of α-Syn (100 μm) incubated for 1 h at 37 °C, in 50 mm Tris-HCl, pH 7.5, 150 mm KCl, 0.5 mm ATP, and 0.05 mm MgCl2 with increasing concentrations of Hsc70 (0.1 to 10 μm, solid line), Hsc70 and Hdj1 (dotted line), or Hsc70 and Hdj2 (dashed line). A, fluorescence intensity recorded for increasing concentrations of Hsc70, Hsc70 and Hdj1, or Hsc70 and Hdj2 alone (filled symbols) or in the presence of α-Syn (open symbols). B, change in fluorescence intensity after subtracting the contribution of Hsc70, Hsc70 and Hdj1, or Hsc70 and Hdj2 from the overall signal in α-Syn-Hsc70, Hsc70 and Hdj1, or Hsc70 and Hdj2 mixtures.

