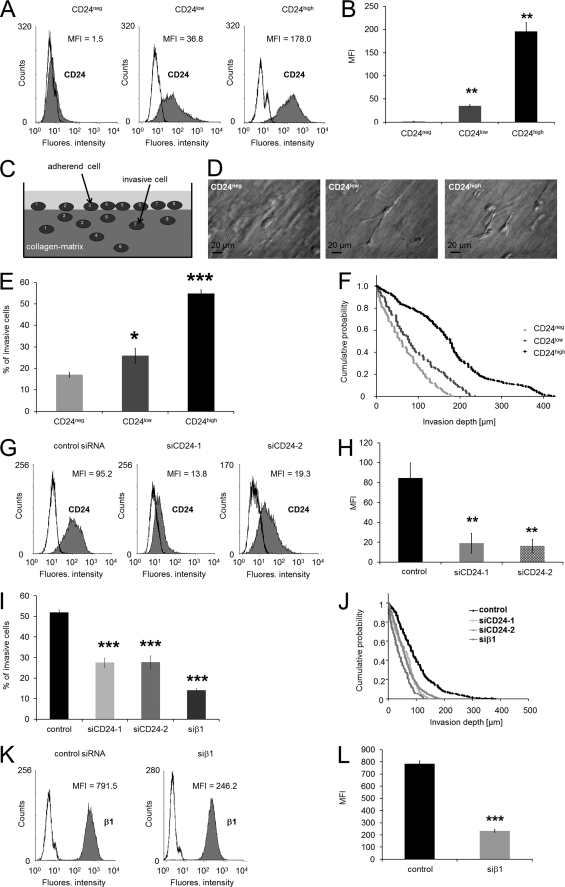
FIGURE 1.
High CD24 expression increased human lung carcinoma cell invasion. A, flow cytometric analysis ((R)-PE-labeled-labeled antibodies) of CD24 cell-surface expression on CD24neg, CD24low, and CD24high cells. B, data (MFI) of CD24 expression on CD24neg, CD24low, and CD24high cells are presented as means ± S.D. (n = 3). C, schematic image of the invasion assay. D, modulation contrast images of representative invasive lung carcinoma cells wild type (left), stably transfected with CD24 and sorted for low expression (middle), and high expression (right) that invaded into three-dimensional ECMs. Scale bars, 20 μm. E, percentage of invasive cells and invasion profiles (F) of CD24neg, CD24low, and CD24high cells are shown that invaded into three-dimensional ECMs after 3 days of culture. G, flow cytometric analysis (Cy2-labeled antibodies) of CD24 cell-surface expression on CD24high cells transfected with control siRNA (left), CD24-specific (siCD24-1) siRNA (middle), or CD24-specific (siCD24-2) siRNA (right). One representative experiment of three is shown. H, MFI (mean ± S.D., n = 3) of CD24 expression on CD24high cells treated with control siRNA, siCD24-1, or siCD24-2. I, percentage of invasive cells and invasion profiles (J) of CD24high cells that were treated with control siRNA, CD24-specific siRNA (siCD24-1 and siCD24-2), or β1-integrin subunit-specific siRNA that invaded into three-dimensional ECMs after 3 days of culture. K, flow cytometric analysis of the β1-integrin subunit cell-surface expression on CD24high cells transfected with control siRNA (left) or β1-integrin-specific (siβ1) siRNA (right). One representative experiment of three is shown. L, MFI (mean ± S.D., n = 3) of β1-integrin expression on CD24high cells treated with control siRNA or siCD24-1 or siβ1. (*, p < 0.05; **, p < 0.01; ***, p < 0.001.)

