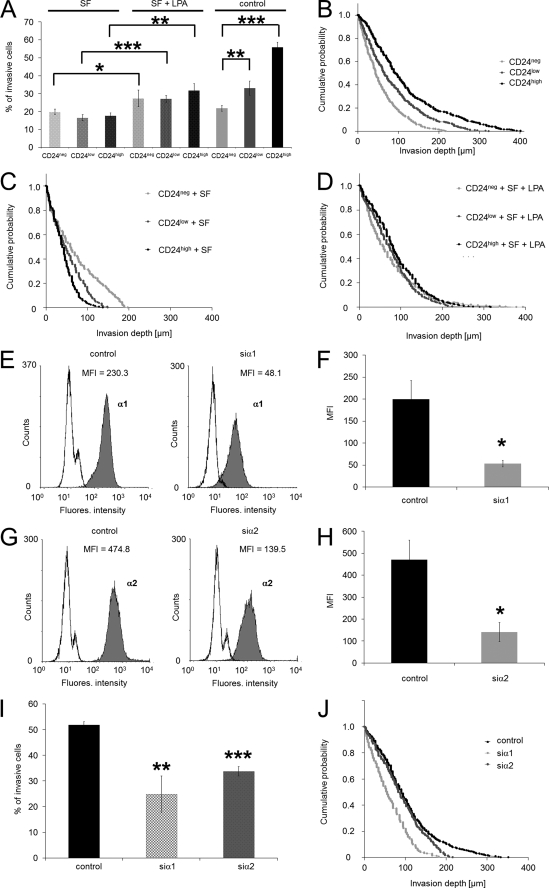
FIGURE 2.
Knockdown of the α1- and α2-integrin subunits in CD24-facilitated invasiveness of cancer cells and effect of serum on cell invasion. A, percentage of invasive cells and invasion profiles of CD24neg, CD24low, and CD24high cells cultured in serum-free medium (SF) (C), serum-free and LPA-stimulated (SF + LPA) (D), and in medium with serum (B) that invaded into three-dimensional ECMs after 3 days of culture. E, flow cytometric analysis of α1 cell-surface CD24high cells transfected with control siRNA (left) or α1-specific siRNA (siα1, right panel). One representative experiment of three is shown. F, MFI (mean ± S.D., n = 3) of α1-integrin expression on CD24high cells treated with control siRNA or siα1. G, flow cytometric analysis of α2 cell-surface CD24high cells transfected with control siRNA (left panel) or α2-specific siRNA (siα2, right panel). One representative experiment of three is shown. H, MFI (mean ± S.D., n = 3) of α2-integrin expression on CD24high cells treated with control siRNA or siα2. I, percentage of invasive cells and invasion profiles of CD24high cells (J) treated with control siRNA, α1-integrin subunit-specific siRNA (siα1) and α2-integrin subunit-specific siRNA (siα2) that invaded into three-dimensional ECMs after 3 days of culture. (*, p < 0.05, **, p < 0.05; ***, p < 0.001.)

