FIGURE 3.
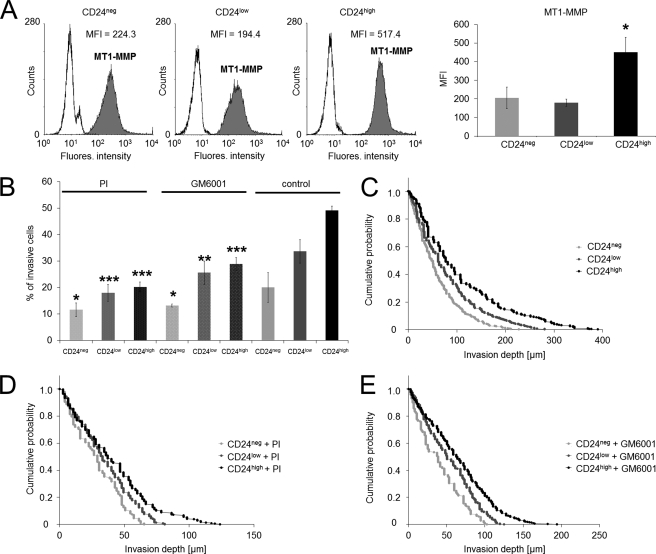
MT1-MMP expression of CD24neg, CD24low, and CD24high cells and effect of proteinase inhibition on three-dimensional ECM invasion. A, left panel, flow cytometric analysis of the MT1-MMP receptor expression on the cell surface of CD24neg, CD24low, and CD24high cells. One representative experiment of three is shown. Right panel, MFI (mean ± S.D., n = 3) of MT1-MMP receptor expression on CD24neg, CD24low, and CD24high cells. B, percentage of invasive cells in the presence of an protease inhibitor mixture (PI), GM6001 inhibitor, or DMSO buffer control and invasion profiles of CD24neg, CD24low, and CD24high cells cultured in the presence of PI (D), GM6001 inhibitor (E), or DMSO buffer control (C) that invaded into three-dimensional ECMs after 3 days of culture. (*, p < 0.05; **, p < 0.05; ***, p < 0.001.)

