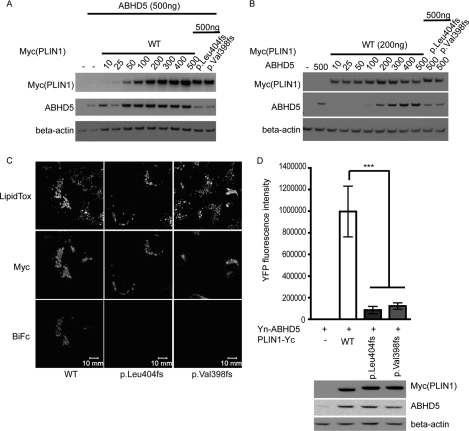
FIGURE 4.
The C terminus of PLIN1 interacts with ABHD5 on lipid droplets. A, titration of PLIN1(WT)-Yc against a fixed amount of Yn-ABHD5 (200 ng of plasmid DNA) indicates that transfection of 200 ng of plasmid encoding wild-type PLIN1 results in PLIN1 levels equivalent to those seen in cells transfected with 500 ng of plasmids encoding the PLIN1 mutants. B, titration of Yn-ABHD5 against 200 ng of plasmid encoding PLIN1 (WT)-Yc indicates that 200 ng of plasmid encoding Yn-ABHD5 results in ABHD5 levels equivalent to those seen in cells transfected with 500 ng of plasmid encoding Yn-ABHD5 and 500 ng of plasmids encoding the PLIN1 mutants. C, direct interaction between PLIN1and ABHD5 was assessed using BiFc in COS7 cells after normalizing for equal expression of each protein. Plasmids encoding Yn-ABHD5 and Myc-PLIN1-Yc were cotransfected in COS7 cells and stained with anti-Myc and anti-rabbit-Alexa 594 antibodies and LipidTOX Deep Red to label lipid droplets. The presence of BiFc indicates direct interaction between PLIN1 and ABHD5. D, the BiFc signal was quantified as described under “Experimental Procedures.” Data are mean ± S.E. from ten 76.5 μ × 76.5 μ frames in one experiment and are representative of six independent experiments. The lower panel confirms equal expression levels of PLIN1 and ABHD5 in data sets being compared in the bar graph. ***, p < 0.001.

