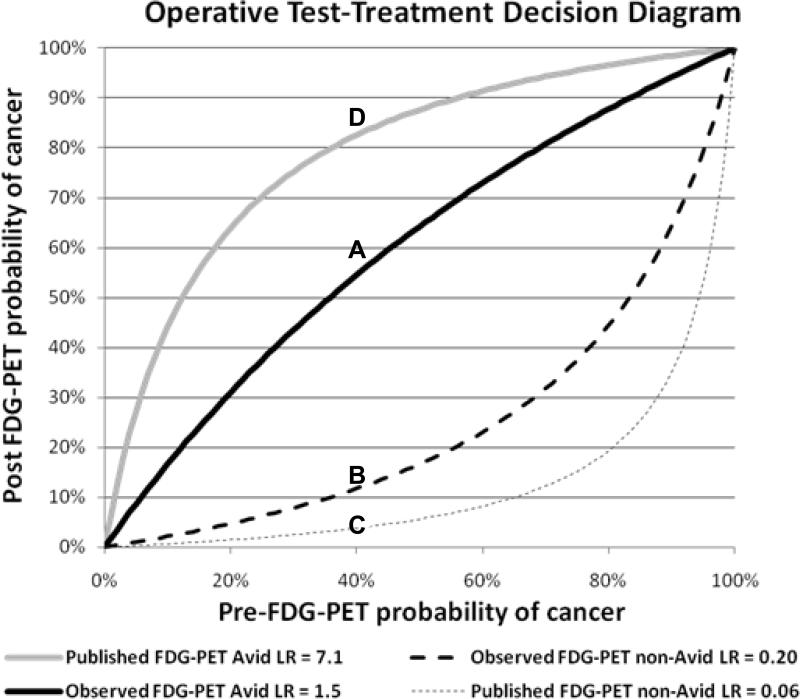
Figure 1.
Operative test-treatment decision diagram. Lines are the calculated likelihood ratios (LR) for the respective FDG-PET result based on the pre-test probability of cancer.
Example: In a patient with a 40% pre-FDG-PET probability of cancer, an avid FDG-PET scan gives a 55% probability of cancer in our observed population (Line A). A non-avid FDG-PET result yields a 12% likelihood of cancer (Line B). In this example using our data, FDG-PET result, whether avid or non-avid, does not change recommendation for resection. However, in other areas of the country, a 40% pre-FDG-PET probability of cancer results in a post FDG-PET probability of only 4% with a non-avid FDG-PET result (Line C) and an 84% post-FDG-PET probability of cancer in an avid FDG-PET (Line D).

