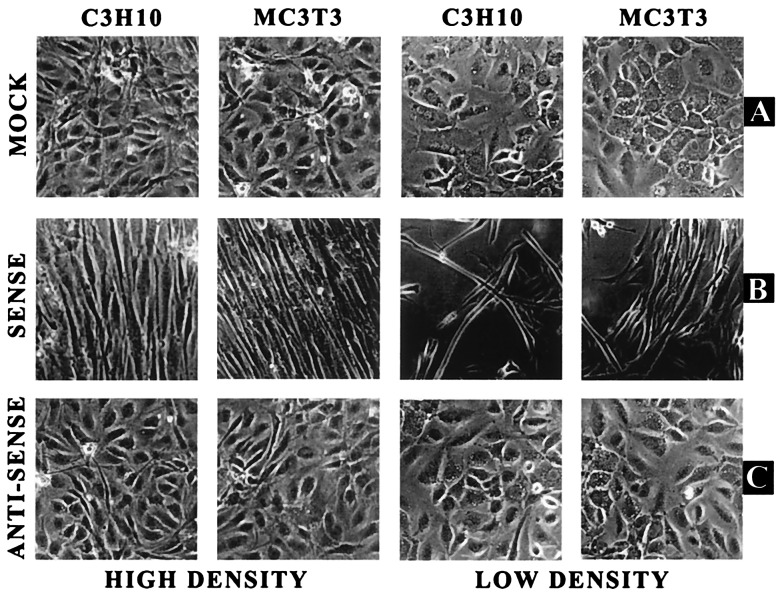
Figure 2.
DMP1 overexpression and morphology. The G418-resistant cells were plated at high density (3 × 10⁶ cells per milliliter) and low density (1 × 10⁴ cells per milliliter). The cells were allowed to grow in the appropriate medium for 24 h, and photographs were taken with a phase-contrast microscope. “Mock” represents a stable cell line expressing the “empty” vector (A). “Sense” (B) and “antisense” (C) represent the stable cell lines overexpressing sense and antisense DMP1 cDNA. Microphotographs were taken at ×10 with a Nikon camera.

