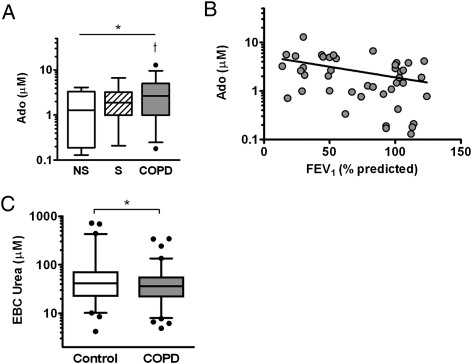
Figure 4.
A, Concentrations of Ado in airway surface liquid were calculated using EBC to serum urea-based dilution factors. Airway surface Ado concentrations differed among the cohorts and were higher in subjects with COPD relative to NS group subjects. *P < .05 by analysis of variance, †P < .05 vs NS. B, Airway Ado concentrations correlated with FEV1 % predicted (r = −0.39, P < .01). C, EBC urea concentrations (measured after lyophilization) were assessed as a surrogate marker of dilution available in the entire cohort. Values were highly variable but modestly lower in subjects with COPD relative to healthy control subjects. *P < .05 by Mann-Whitney. See Figure 1 and 2 legends for expansion of abbreviations.

