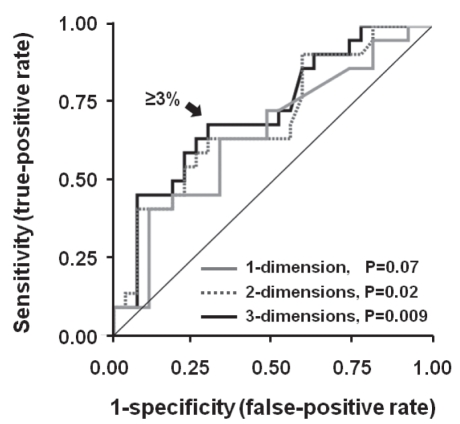
Figure 2).
ROC curves for predicting mortality after transarterial chemoembolization in patients with hepatocellular carcinoma. The area under the curve (AUC) for two-dimensional tumour size reduction was 69 (95% CI 0.54 to 0.84; P=0.02), and for three-dimensional measurement, the AUC was 0.72 (95% CI 0.58 to 0.86; P=0.009). The one-dimensional measurement was less accurate for six-month mortality discrimination (AUC 0.65 [95% CI 0.50 to 0.81]; P=0.07)

