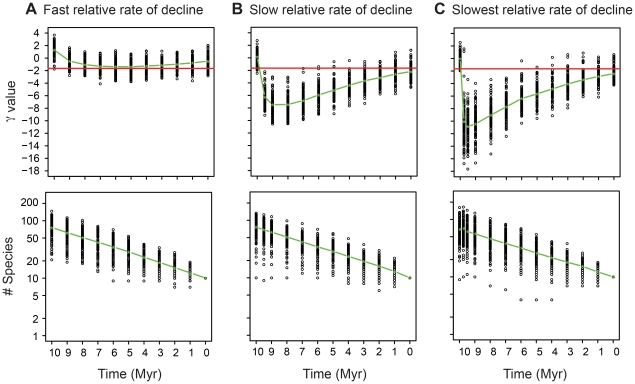
Figure 3. The γ statistic and number of species through time for all simulated trees for the decline phase (last 10 MY) for the clades in decline simulations ( Figure 1A–C ).
Note that while the diversity declines are effectively the same for all three simulations (bottom row), the different diversification phases result in different γ values (upper row). The green line represents the average γ statistic or average number of species. The red line represents the 5% cutoff point for rejecting the null hypothesis of constant diversification (γ = −1.645).

