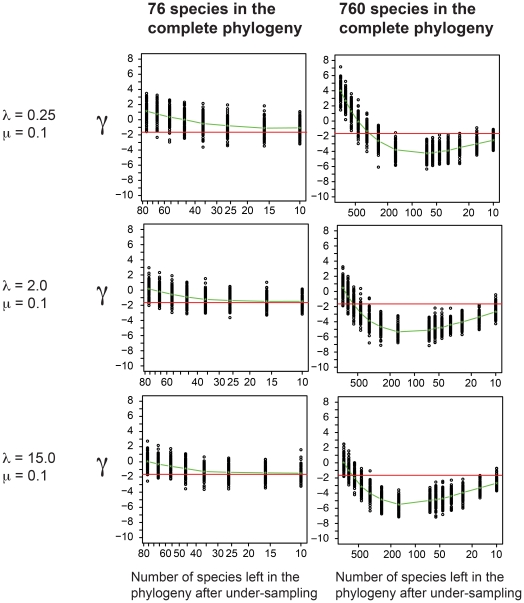
Figure 4. The effects of under-sampling on the γ statistic.
The phylogenies were generated using the same three exponential rates of increase used in the clades-in-decline simulations (grey portion of Figures 1A–C). Two final diversities were used, 76 species (left column) and 760 species (right column). The green line represents the average γ statistic. The red line represents the 5% cutoff point for rejecting the null hypothesis of constant diversification (γ = −1.645). Under-sampling has a surprisingly small effect on the γ value – the reason for the highly negative γ values seen in our simulations has little to do with extinction mimicking the effects of under-sampling.

