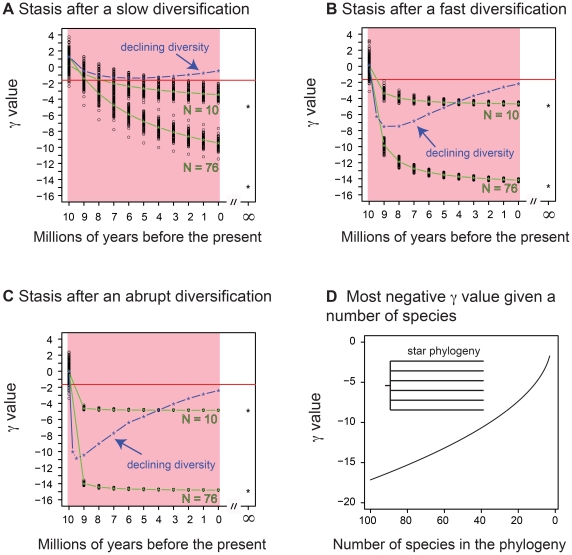
Figure 5. A–C) The evolution of the γ statistic (green line) for all simulated trees in the pure aging scenario after initial exponential growth.
A) Stasis after a slow diversification. B) Stasis after a fast diversification. C) Stasis after an abrupt diversification. The asterisk at time = ∞ represents the most negative value possible for the γ statistic for a given phylogeny with 10 or 76 species, which corresponds to a phylogeny after an infinitely long aging phase (i.e., a star phylogeny). The blue line represents the average γ statistic for the clades in decline simulations (data from Figure 3). The red line represents the 5% cutoff point for rejecting the null hypothesis of constant diversification (γ = −1.645). D) The expected most negative value for the γ statistic for given phylogeny as a function of the number of species (based on [6]); this represents a phylogeny with a star topology.

