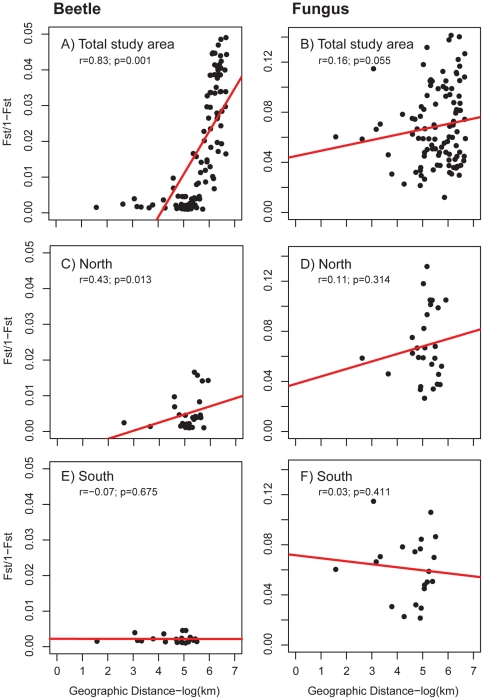
Figure 3. Isolation by distance plots.
Genetic distance is plotted as a function of geographic distance for beetles (left columns) and fungus (right column) for the entire study area (A & B), the northern region (C & D), and the southern region (E & F). Note the different scales for the beetle and fungal plots. Red lines show the best fit line to the data and are included for illustration only. r values represent correlation between geographic and genetic distances matrices assessed using Mantel tests.

