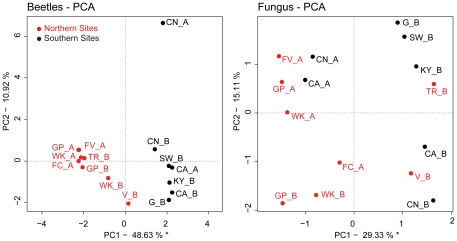
Figure 4. Principal Components Analysis (PCA) of raw allele frequency data.
Plots of site scores for the first two principal components are shown for (a) beetles, and (b) fungi. Percentage values associated with each axis represent the respective proportion of overall variance in allele frequencies captured.

