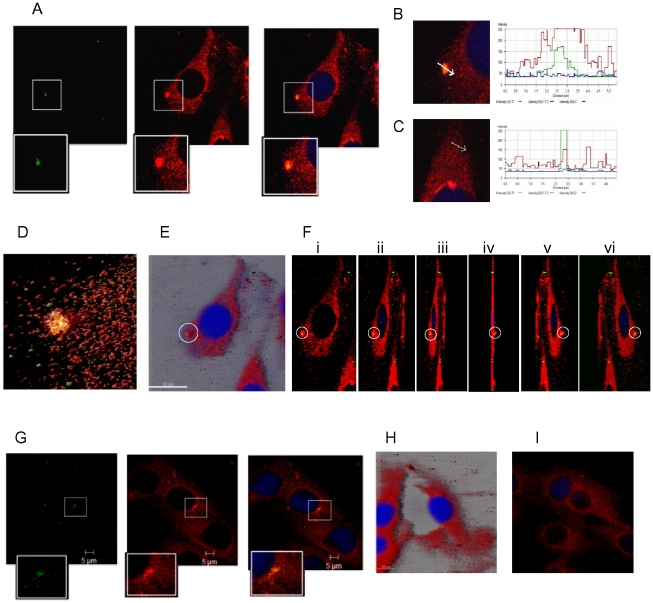
Figure 2. DENV-2 associates with dynamin II during internalization.
BHK-21 cells were infected at MOI of 5. The cells were fixed at different time intervals and stained for DENV-2 with mouse anti-E MAb and for dynamin II with goat anti-dynamin II antibody, followed by donkey anti-mouse IgG Alexa 488 and donkey anti-goat IgG Alexa 594. The images of the E-dynamin complex analyzed using different programs are shown; A] split images with magnified insets at 0 min, B] intensity profile at 0 min showing points of colocalization and C] no colocalization D] 3D deconvolved image of optical sections of 2.5 µm using Huygen's essential software E] Maximum Intensity projection (MIP) highlighting the surface location of the complex (Imaris 7.0) F] 3 D projections at different angles (i) 60°, ii) 90°, iii) 100°, iv)110°, v) 120° and vi) 130° using Carl Zeiss AIM 4.0. G] split image at 30 min and H] no association at 1 h (Imaris 7.0). I] Mock infected cells showing the presence of dynamin II.

