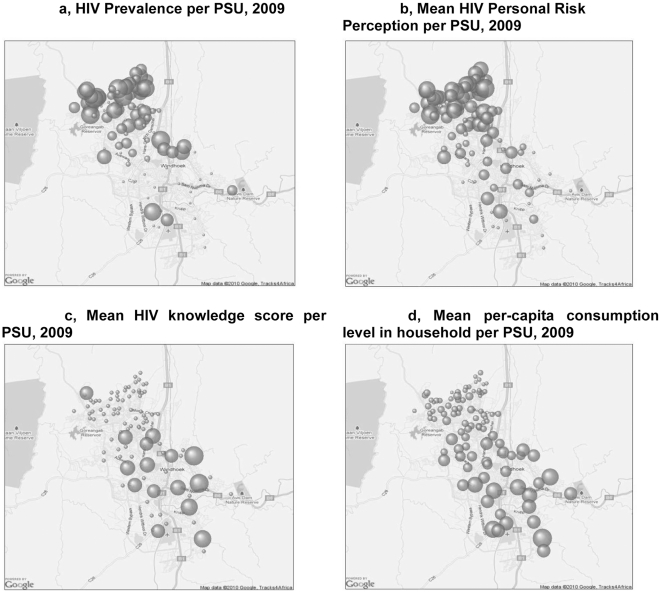
Figure 2. Geographic representation of the city of Windhoek with “bubble-graphs” representing values of various indicators.
Figure 2a , HIV Prevalence per PSU, 2009/The HIV prevalence ranged from 0 to 47%. Figure 2b , Mean HIV Personal Risk Perception per PSU, 2009: The HIV risk perception was measured on a 1 to 4 scale. The mean score per PSU ranged from 0 to 1.7. Figure 2c , Mean HIV knowledge score per PSU, 2009: HIV knowledge was measured according to a 1–11 scale. The mean score per PSU ranged from 2.3 to 11.0. Figure 2d , Mean per-capita consumption level in household per PSU, 2009: Mean Per capita consumption level per PSU ranged from 485$ to 125,800$ per month. One outlier of 530,800$ per month has not been included in this graph.

