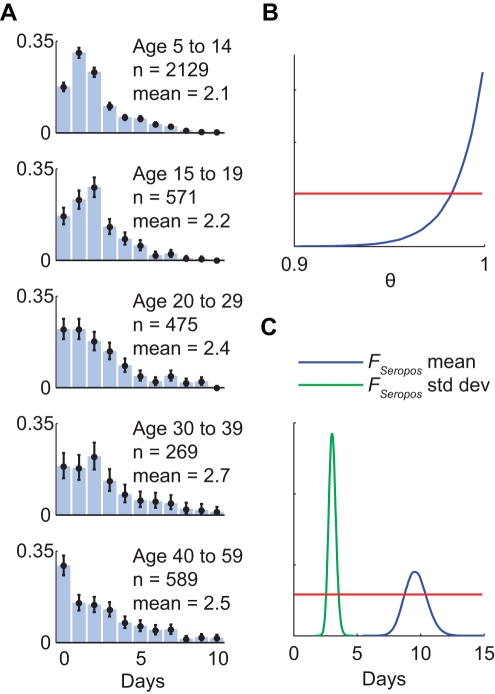
Figure 2. Time delay from illness onset to hospitalization, proportion of infected cases who reached seropositivity, and time delay from illness onset to seropositivity.
(A) Probability density functions of the age-specific delay between illness onset and hospitalization as observed in the e-flu database surveillance data. Black bars indicate 95% confidence intervals. (B and C) Statistical analysis of published data on the kinetics of pdmH1N1 antibody response among laboratory-confirmed cases in the US [14]. Posterior distributions were obtained using Markov chain Monte Carlo method with non-informative priors (red lines); see Text S1 for details. (B) The posterior distribution of the proportion of laboratory-confirmed cases who eventually developed MN titer ≥1∶40. (C) The posterior distributions of the mean and standard deviation of the delay between illness onset and seropositivity assuming that the delay distribution F Seropos was Erlang-10.

