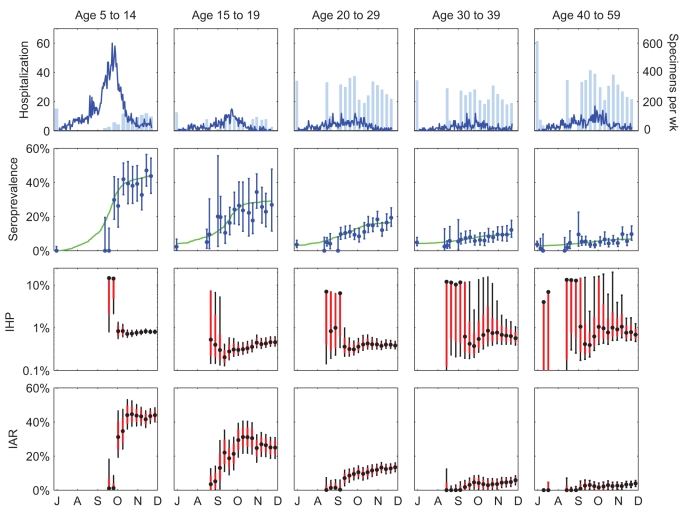
Figure 3. Hospitalization data, serial cross-sectional serologic data, and sequential real-time estimates of IHP and IAR for pdmH1N1 in Hong Kong.
Each tick on the x-axis indicates the first day of the months July through December 2009. The first row shows the daily number of hospitalizations (blue lines) and the number of serum specimens (light blue bars) tested before 30 June 2009 (left-most bar in each graph) and in subsequent weeks. The second row shows the serial cross-sectional serologic data (blue circles indicate MLEs and bars indicate 95% confidence intervals of seroprevalence in each cross-section) and the seroprevalence curves in the full model (green lines). The third and fourth rows show the sequential real-time estimates of IHP and IAR, respectively (black circles for MLEs, black bars for 95% confidence intervals, and red boxes for IQRs). Estimates were sequentially updated upon each new cross-section of serologic data. Each batch of serologic data was assumed to be available 3 d after the last sample of that batch was collected.

