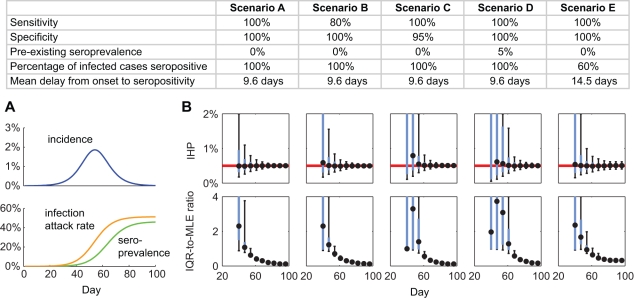
Figure 4. Serial cross-sectional sero-surveillance for future pandemics.
(A) Simulated incidence, IAR, and seroprevalence using a susceptible-infected-removed model with basic reproductive number R 0 = 1.4 and mean generation time T g = 2.5 d. (B) Performance of serial cross-sectional sero-surveillance for the simulated epidemic in five scenarios (across the columns; see the table for the scenario descriptions). For each scenario, we simulated 500 stochastic realizations of sero-surveillance with 300 serologic samples per week starting 28 d after seeding. The top row of graphs shows the frequency distributions of sequential IHP MLEs, and the bottom row of graphs shows the frequency distribution of the sequential IQR-to-MLE ratios. In the top panels, the red lines indicate the true value of IHP = 0.5%. In all panels, black circles indicate the median, while blue boxes and black vertical bars indicate IQRs and 95% confidence intervals of the ordinate, respectively.

