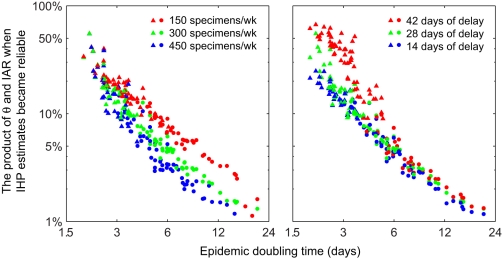
Figure 5. Performance of serial cross-sectional sero-surveillance in 100 randomly generated epidemic scenarios.
All x- and y-axes are in log-scale. For each scenario, 200 stochastic realizations of serial cross-sectional sero-surveillance were simulated. (A) Sero-surveillance begun 28 d after epidemic seeding with 150 (red), 300 (green), and 450 (blue) specimens per week. (B) Sero-surveillance begun 42 (red), 28 (green), and 14 (blue) d after epidemic seeding with 300 specimens per week. Points represent the mean (among the 200 realizations) of θ × IAR at the threshold where a reliable estimate of IHP was obtained (defined as the stage of epidemic after which [1] all subsequent MLEs of IHP were within 50% of the true value and [2] all subsequent IQR-to-MLE ratios were less than three) in a given epidemic scenario; circles and triangles indicate that the reliable IHP estimate was obtained before and after the epidemic peak, respectively.

