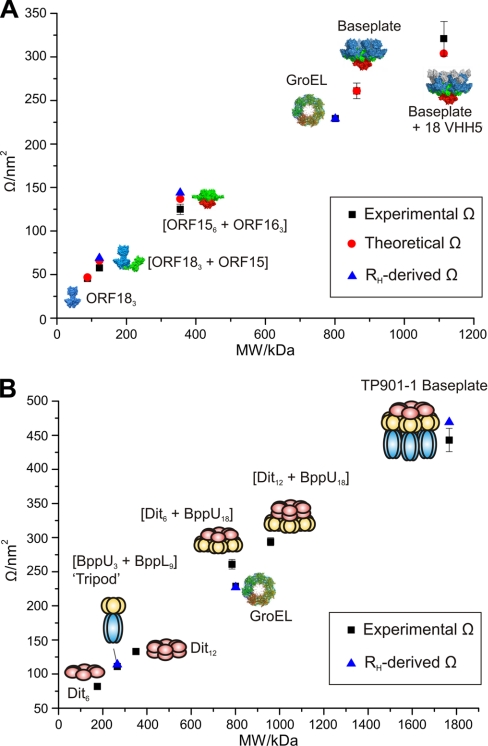
Fig. 3.
A comparison of molecular mass with cross-sectional area measurements for phage complexes. Molecular mass (kDa) versus cross-sectional areas measured by IMS-MS (black squares), calculated using an in-house projection approximation algorithm (red circles) and derived from RH (light scattering) measurements (blue triangles) for (A) p2 baseplate and a range of subcomplexes: ORF18 (blue), ORF16 (red), ORF15 (green), and VHH5 (gray); and (B) TP901–1 baseplate and a range of subcomplexes: Dit (pink), BppU (yellow), and BppL (blue). The chaperonin, GroEL, is shown on both graphs for reference. Error bars on the ESI-IMS-MS measurements represent the standard deviation of three measurements whenever available (supplementary Table S1).

