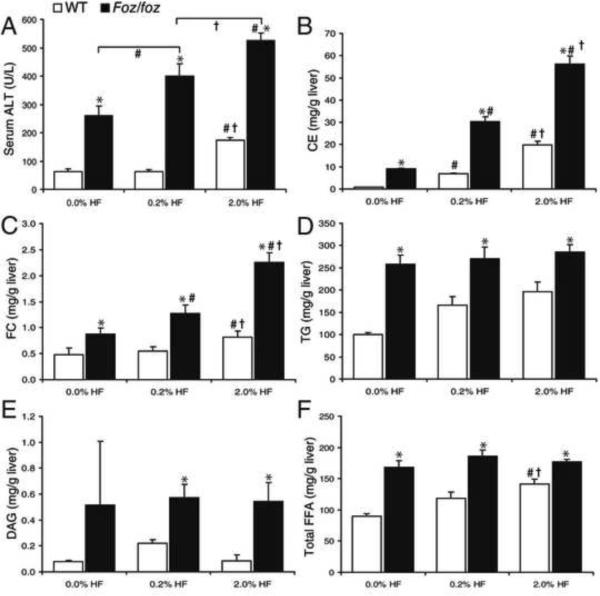
Figure 5. Dietary cholesterol modulates hepatic cholesterol content and liver injury, but not other lipid profiles in NASH.
(A) Serum alanine transaminase (ALT), (B) total hepatic cholesteryl ester (CE), and (C) hepatic free cholesterol (FC) content in WT (□) and foz/foz (▪) mice (n values as per METHODS) fed HF-diet containing 0, 0.2 or 2.0% (w/w) cholesterol for 24-weeks. (D) Hepatic TG, (E) diacylglycerides (DAG), and (F) total free fatty acids (FFA), as determined by HPLC. *P<0.05, vs. diet-matched control. #P<0.05, vs. genotype-matched, 0.0% cholesterol groups. †P<0.05, vs. genotype-matched, 0.2% cholesterol groups

