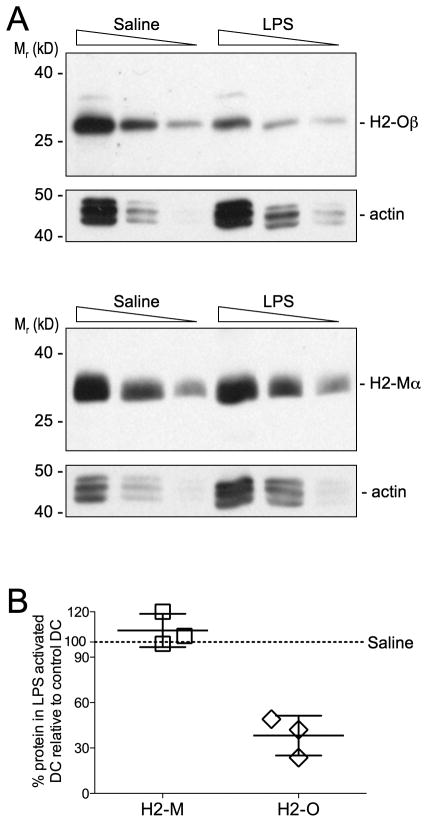
FIGURE 2.
Biochemical analyses of H2-O downregulation following in vivo DC activation by LPS. A Titrated amounts of splenic DC detergent lystates (4, 2 and 1 × 10⁵ DC equivalents/lane) from mice injected 16 hr earlier with LPS or saline (control) were separated by SDS-PAGE, transferred to membranes and probed with Abs specific for the cytoplasmic tail of H2-Oβ (top) or H2-Mα (bottom). To demonstrate proportional loading, the blots were also probed with a mAb specific for actin. Data are representative of three independent experiments. B Quantification of the level of H2-Oβ and H2-Mα for DC from LPS injected mice relative to the level from control (saline) injected) mice. Each symbol represents an individual experiment and small horizontal bar indicates the mean ± SD.

