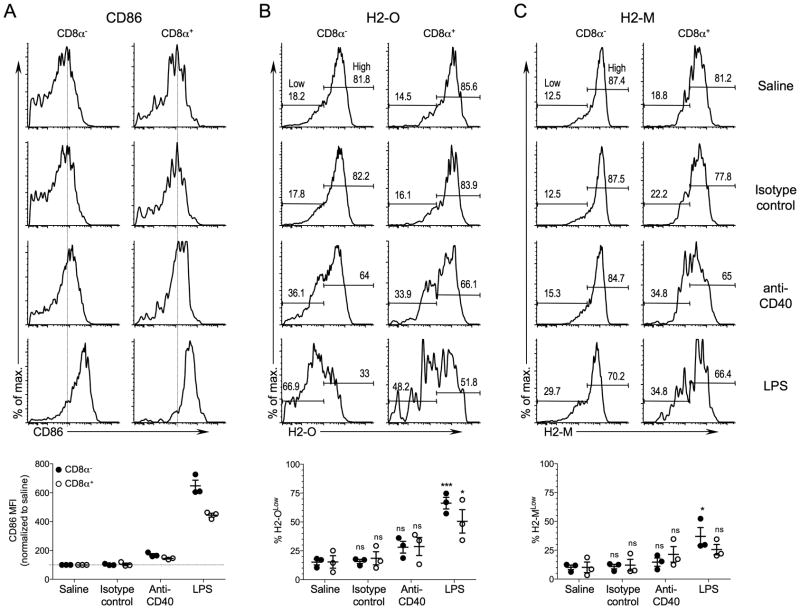
FIGURE 4.
In vivo maturation of DCs with anti-CD40 antibody does not result in significant H2-O down-modulation. B6 mice were injected intravenously with saline, anti-CD40 Ab, isotype control Ab, or LPS, and 16 hr later spleens were harvested and subjected to flow cytometric analyses to determine CD86 (A), H2-O (B) and H2-M (C) levels for CD8α− and CD8α+ DCs. DCs were identified as CD8α− and CD8α+ DCs as shown in Figure 1. Numbers on histogram plots for H2-O and H2-M represent the percent of cells falling within the Low and High gates as indicated. Vertical dashed lines on CD86 histograms are provided to aid comparison of CD86 levels. Graphs at bottom show quantification of CD86 (mean fluorescence intensities for each condition relative to saline injected mice), H2-O and H-2M levels for CD8α− and CD8α+ DCs after in vivo DC activation for multiple mice and experiments. H2-O and H2-M levels were separated into Low and High expressing populations as indicated on the histograms for saline injected control mice and the % of H2-OLow (B)and H2-MLow (C) among the CD8α− and CD8α+ DCs after in vivo activation were plotted. Data were pooled from three independent experiments. The statistical significance of potential differences between the percent H2-OLow or H2-MLow DCs obtained for saline injected and anti-CD40 Ab, control Ab or LPS injected mice was determined by the Student’s T test. ns, nonsignificant.

