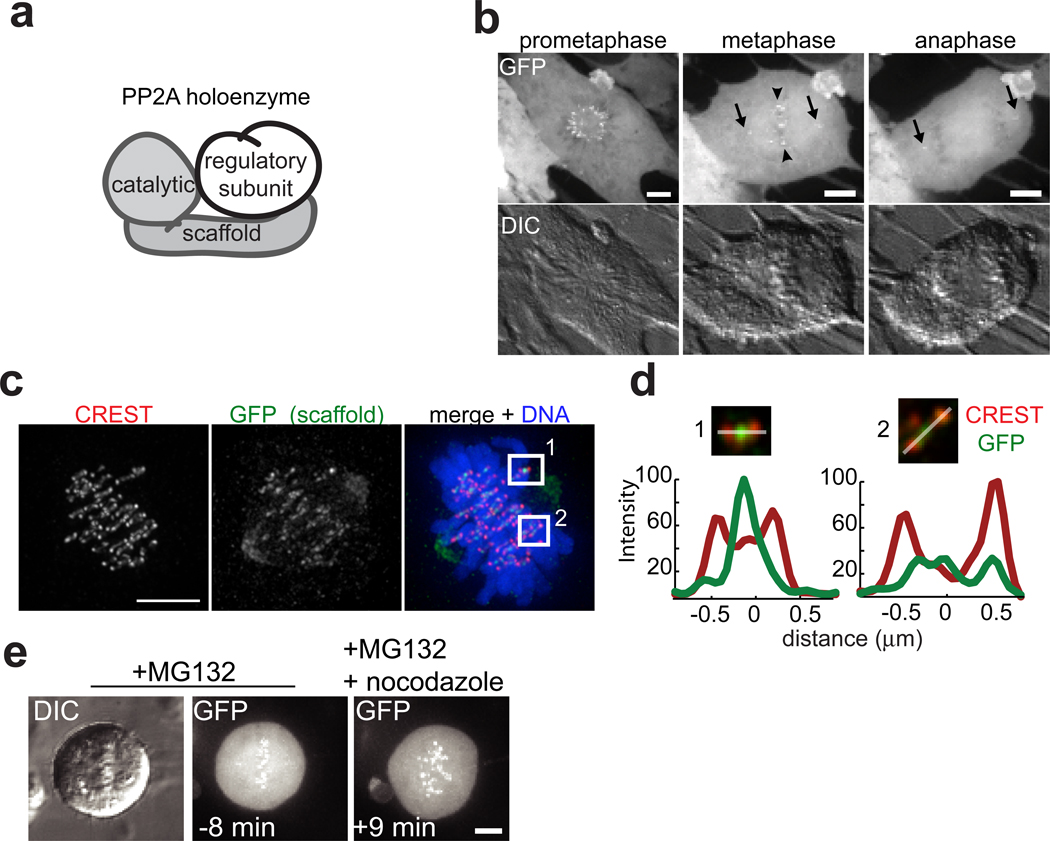
Figure 1.
Microtubule-sensitive targeting PP2A to centromeres/kinetochores during cell division. (a) Schematic showing PP2A’s scaffold, catalytic, and regulatory subunits. (b) Maximum intensity confocal projections show distributions of GFP-scaffold expressed in an RPE1 cell at mitosis (top). Centrosome (arrow) and centromere (arrowhead) localizations are indicated. DIC images (below) show chromosomes in same cell. (c) Immunofluorescence images of a maximum intensity projection of an RPE1 cell expressing GFP-scaffold fixed and stained for kinetochores (CREST, red), GFP (green) and DNA (blue, only shown in overlay). (d) Maximum intensity projection of the optical sections spanning the boxed regions in (c) enlarged 2x with DNA omitted. Plotted is the intensity profile of the CREST (red) and GFP (green) signal measured along a line (white) drawn across the centromere. (e) Maximum intensity confocal projections of GFP-scaffold distribution and chromosomes (DIC) in a cell arrested in metaphase (10 µM MG132), and imaged live at the indicated times relative to addition of nocodazole (3.2 µM, time zero). Scale bars, 5 µm.

