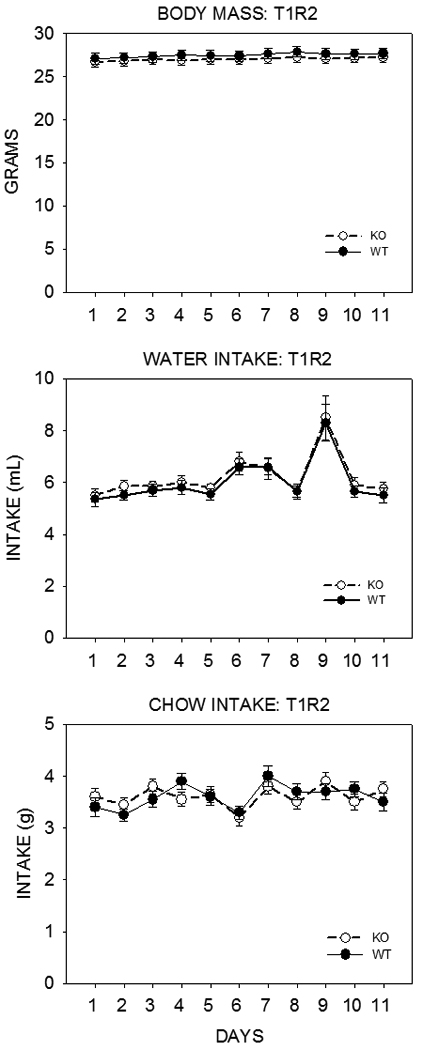
Figure 5.

Mean ±SE body weight (top), daily water (middle) and chow (Purina Laboratory Chow 5001, St. Louis, MO) (bottom) intake of adult T1R2 KO mice (open symbols) and their same-sex WT littermate controls (closed symbols) for 11 days. The mice were housed individually in polycarbonate tub cages under a 12 h/12 h light/dark cycle in a room that had temperature and humidity automatically controlled. Each genotype group consisted of 12 males and 8 females. These mice had been previously tested in brief access tests with sugars, Na-saccharin, and Polycose. The mean age of the mice in each group was 29.3 ± 0.47 weeks. In a three-way ANOVA (genotype × sex × day) there was no significant main effect of genotype (F(1,36)=0.826, p=0.369) and no significant genotype × sex (F(1,36)=0.992, p=0.326), genotype × day (F(10,360)=0.780, p=0.648), or genotype × sex × day (F(10,360)=0.527, p=0.871) interactions for body weight; no significant main effect of genotype (F(1,36)=0.188, p=0.667) and no significant genotype × sex (F(1,36)=0.136, p=0.714), genotype × day (F(10,360)=0.112, p=1.000), or genotype × sex × day (F(10,360)=0.488, p=0.898) interactions for water intake; no significant main effect of genotype (F(1,36)=0.012, p=0.913) and no significant genotype × sex (F(1,36)=0.109, p=0.743), genotype × day (F(10,360)=1.379, p=0.188), or genotype × sex × day (F(10,360)=0.366, p=0.961) interactions for food intake. The perturbation in water intake on Day 9 is unexplained but when this data point was excluded, the statistical outcomes reported remained the same.
