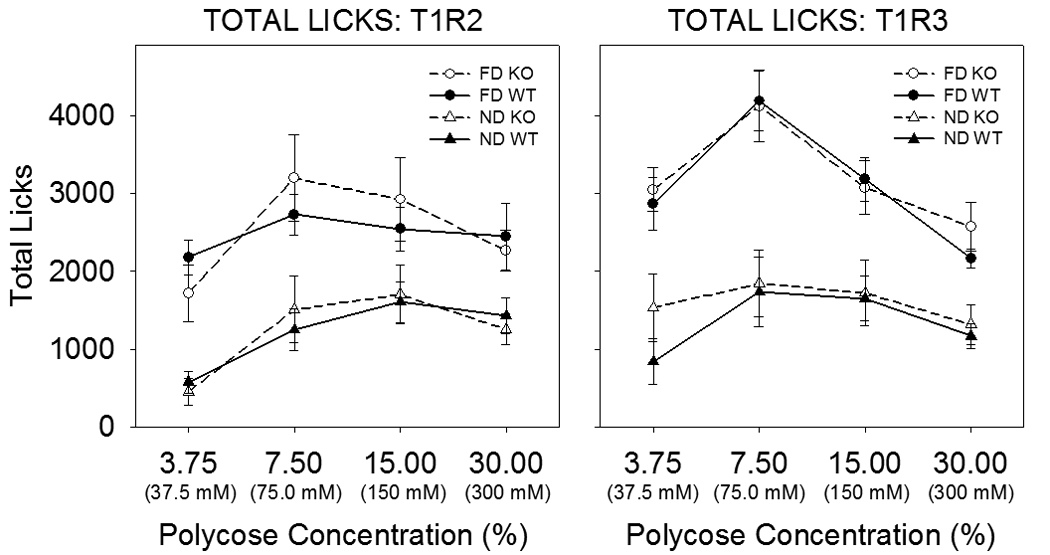
Figure 7.

Mean ±SE total licks of Polycose as a function of concentration and fasting state by T1R2 (left panel) and T1R3 (right panel) KO mice (open symbols) and their WT littermate controls (closed symbols) in 30-min intake tests in a Davis Rig lickometer with a stationary drinking spout. The mean age of the mice at the start of testing for each T1R2 genotype (n=8) was 44.9 ± 1.48 weeks and for each T1R3 genotype (n=9) was 33.4 ± 0.69 weeks. Licking as opposed to intake was measured to avoid inaccuracies in volume measurement due to spillage, and it was assumed that the lick volumes were not different across the genotypes. The animals were tested after 23.5 h of food deprivation on one day (FD: circles) and then food was replaced and the animals were tested the next day in a non-deprived state (ND: triangles). This pattern was followed for four days (2 days deprived, 2 days non-deprived) at each concentration (ascending series). On 7 occasions involving 6 mice, data was lost due to a computer problem. For 5 of these mice, the licks from the complementary day were used instead of the mean of the two days in the analysis. For the sixth mouse, however, the computer problem happened on both days of the same condition and so this mouse had to be excluded from the analysis. In addition, one mouse was excluded from the analysis because it did not consistently sample the stimulus across sessions. In all cases when mice had to be removed from the analysis, their littermates were also excluded. All of these mice had been previously tested in brief access tests with sugars, Na-saccharin, and Polycose. In a three-way ANOVA (genotype × deprivation state × concentration) of total licks for T1R2 KO mice and their WT controls, there was no significant main effect of genotype (F(1,14)=0.008., p=0.93) and no significant genotype × concentration (F(3,42)=1.27, p=0.30), genotype × deprivation state (F(1,14)=0.043, p=.84), or genotype × deprivation state × concentration (F(3,42)=0.60, p=0.62) interactions. In a three-way ANOVA (genotype × deprivation state × concentration) of total licks for T1R3 KO mice and their WT controls, there was no significant main effect of genotype (F(1,16)=0.188, p=0.67) and no significant genotype × concentration (F(3,48)=0.928, p=0.43), genotype × deprivation state (F(1,16)=0.45, p=0.51), or genotype × deprivation state × concentration (F(3,48)=1.086, p=.36) interactions.
