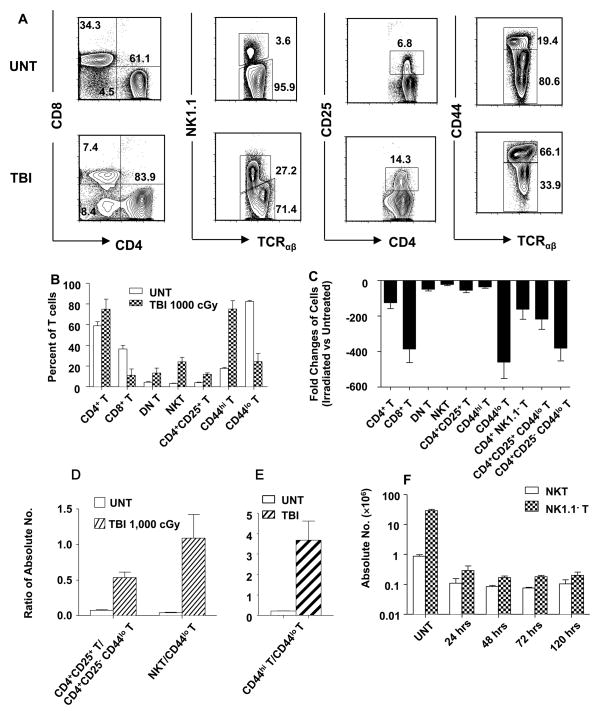
Figure 1. Effect of Irradiation on different T cell subsets in wild type C57BL/6 mice.
(A) Gated TCRαβ+ spleen cells in untreated wild type mice (upper row) or 24 hours after 1,000 cGy of TBI (lower row), were analyzed by flow cytometry for CD4 versus CD8, NK1.1 versus TCRαβ and CD44 versus TCRαβ. Gated CD4+ TCRαβ+ cells were also analyzed for CD4 versus CD25. (B) The mean percentage of CD4+, CD8+, CD4− CD8−(DN), NK1.1+, CD4+CD25+, CD44hi, and CD44lo TCRαβ+ cells in the spleen are shown by the bars (brackets show standard deviations) before and 24hr after irradiation. There are six to ten mice in each group. The data are representative of three independent experiments. P values comparing untreated and irradiated mice means are: CD4+ (p=0.004), CD8+ (p<0.0001), DN (p=0.001), NKT (p<0.0001), CD4+CD25+ (p<0.0001), CD44hi (p<0.0001), CD44lo (p<0.0001). (C) Mean fold change (ratio of irradiated versus untreated) (±SD) in absolute numbers of different T-cell subsets before and 24 hr after TBI. CD4+ T versus CD4+NK1.1− T (p >0.05), CD4+CD25+ T versus CD4+CD25+CD44lo T (p <0.05), CD4+CD25+CD44lo versus CD4+CD25− CD44lo (p<0.05). (D) Mean ratios of absolute numbers of CD4+CD25+ Treg cells versus CD44lo CD4+CD25− T cells (CD4+ naïve non-Treg), and NKT versus total CD44lo T cells before and 24 hr after TBI. (F) Mean absolute numbers (±SD) of NKT and NK1.1− T cells at different time points after TBI (p<0.0001) for NKT and NK1.1− T at 24 hrs versus untreated. p>0.05 at 24 versus 48, 72, and 120 hrs.

