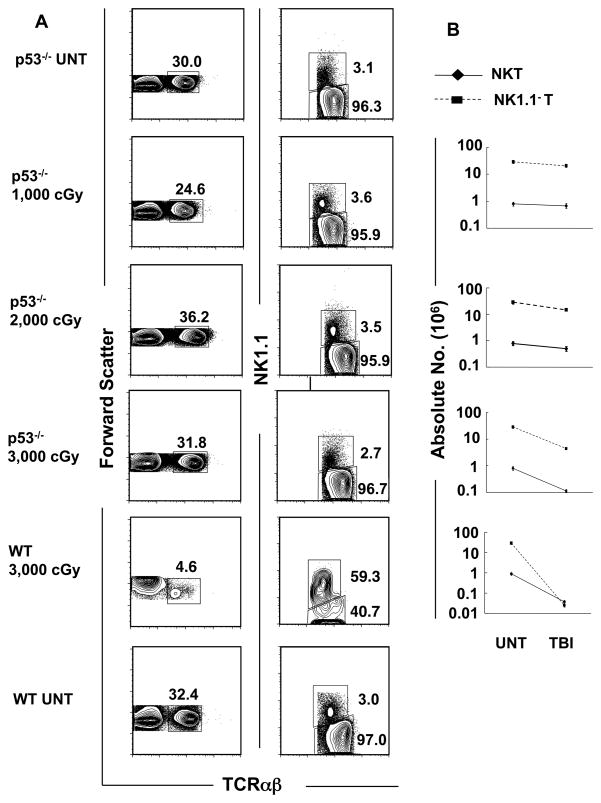
Figure 4. The NKT cell subset fails to become predominant among all T cells after TBI in p53−/− mice.
(A) Upper panels show representative flow cytometric analyses of staining for TCRαβ versus forward scatter or NK1.1 versus TCRαβ on gated TCRαβ+ cells in untreated p53−/− mice or 24hrs after 1000, 2000 or 3000 cGy of TBI. The bottom panels show similar analyses in untreated wild type (WT) mice or 24 hours after 3000 cGy of TBI for comparison. Boxes enclose TCRαβ+ T or NK1.1+ TCRαβ+ cells. The mean percentage ± SD of NKT cells among all T cells in the spleen of untreated mice was 2.8 ± 0.4, and 3.2 ± 0.4; p>0.05, 3.2 ± 0.5; p>0.05, and 2.5 ± 0.4; p>0.05 in mice given 1,000, 2,000, 3,000 cGy respectively. (B) The mean (±SD) absolute numbers of NK T cells and NK1.1− T cells (non-NKT cells) in the spleen of untreated mice and after each dose of irradiation are shown on a logarithmic scale. There are 5 to 10 mice per group. The data are representative of three independent experiments.

