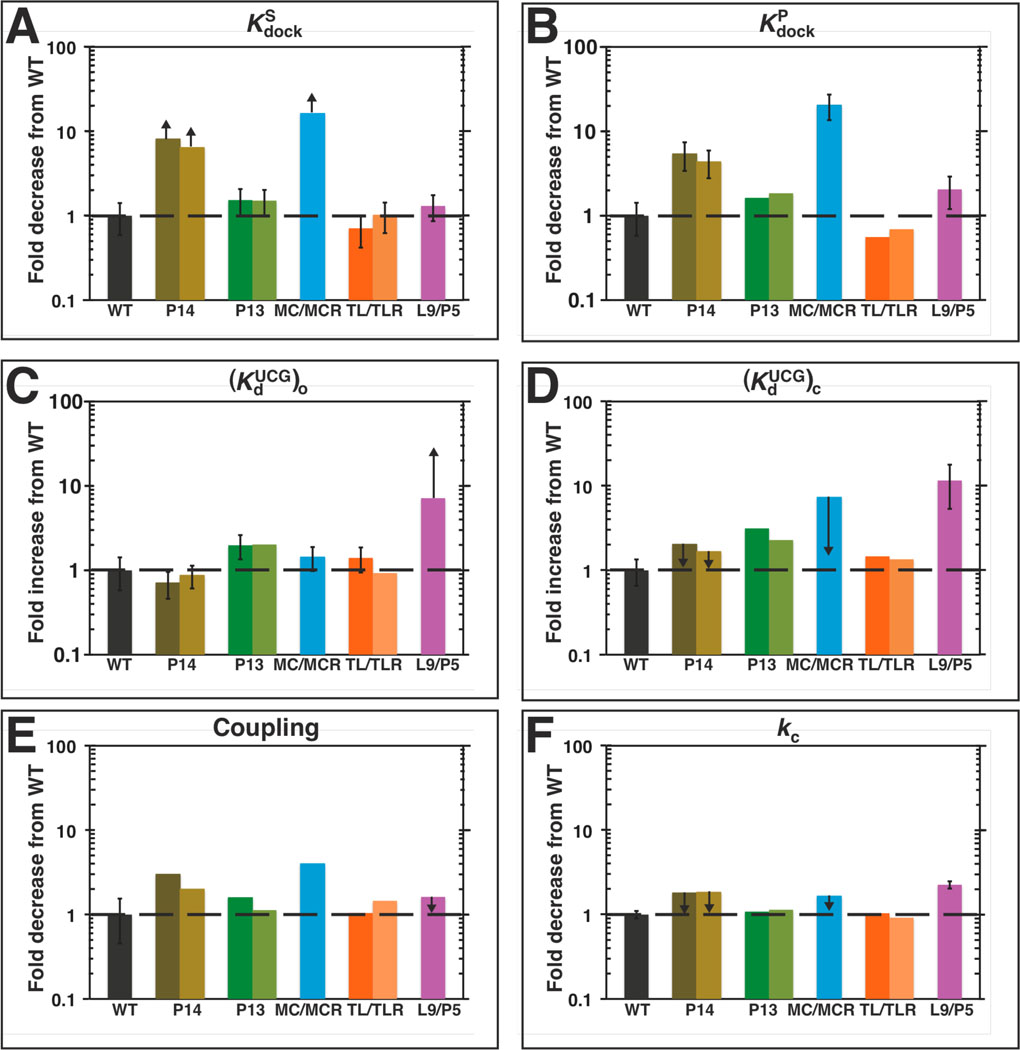
Figure 5.
Differential effects on individual reaction steps from different mutations. A–F. Reactions steps are labeled as in Scheme 1 and eqn 4 and determined as described in the Results and Discussion and Materials and Methods. Table 3 contains the kinetic and thermodynamic values for each individual reaction step, which are presented relative to the WT in this figure. The black dashed is drawn to guide the eye at the value of ‘1,’ which represents no difference between the mutant and WT. Colors are as in Figure 1: WT (black); P13 mutants (L2.1: dark green, L9.1: olive green); P14 mutants (L2: brown; L5c: tan); MC/MCR mutant (blue); TL/TLR mutants (L5b: red-orange; J6a/b: light orange); L9/P5 mutant (purple). Reaction conditions: 30 °C, 10 mM MgCl2, 50 mM Na•MOPS, pH 6.9.

