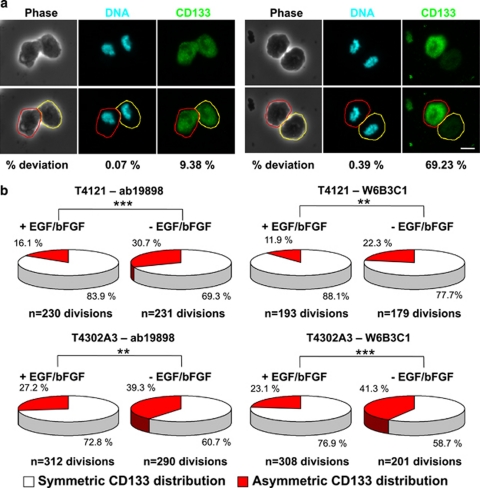
Figure 6.
CD133 asymmetry increased upon growth factor deprivation. (a) Representative phase and fluorescence micrographs of GSCs analyzed during mitosis stained with rabbit antiserum ab19898 against CD133 (green). Similar images were produced with mouse monoclonal antibody W6B3C1 against CD133 (images not shown). Cells were counterstained with Hoechst 33342 (blue) to mark DNA. Analysis occurred by comparing pixel intensities of DNA with CD133 staining in the area containing each emerging daughter cell, as indicated by the red and yellow lines. Examples of symmetrical and asymmetrical distributions of CD133 are shown. Percent deviation in staining between daughter cells is displayed below micrographs. The scale bar indicates 10 μm. (b) Quantification of images as illustrated in a demonstrated that withdrawal of EGF and basic FGF (bFGF) increased the fraction of mitotic pairs with asymmetric CD133 distribution when compared with cultures with EGF and bFGF in both T4121 and T4302 cells. N, number of cell divisions. **P<0.01; ***P<0.001 as assessed using Pearson's χ2-test

