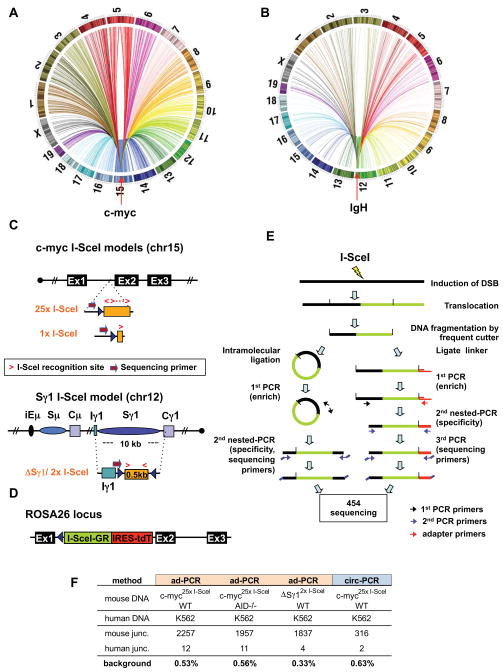
Figure 1. High Throughput Genomic Translocation Sequencing.
(A and B) Circos plots of genome-wide translocation landscape of representative c-myc (A) or IgH (B) HTGTS libraries. Chromosome ideograms comprise the circumference. Individual translocations are represented as arcs originating from specific I-SceI breaks and terminating at partner site. (C) Top: a cassette containing either 25 or one I-SceI target(s) was inserted into intron 1 of c-myc (see Fig. S1A–C). Bottom: a cassette composed of a 0.5 kb spacer flanked by I-SceI target replaced the IgH Sγ1 region. Relative orientation of I-SceI sites is indicated by red arrows. Position of primers for generation and sequencing HTGTS libraries is shown. (D) An expression cassette for I-SceI fused to a glucocorticoid receptor (I-SceI-GR) was targeted into Rosa26 (see Fig. S1D–G). The red fluorescent protein Tomato (tdT) is co-expressed via an IRES. (E) Schematic representation of HTGTS methods; left: circularization-PCR, right: adapter-PCR. See text for details. (F) Background for HTGTS approaches, calculated as percent of artifactual human:mouse hybrid junctions when human DNA was mixed 1:1 with mouse DNA from indicated samples.

