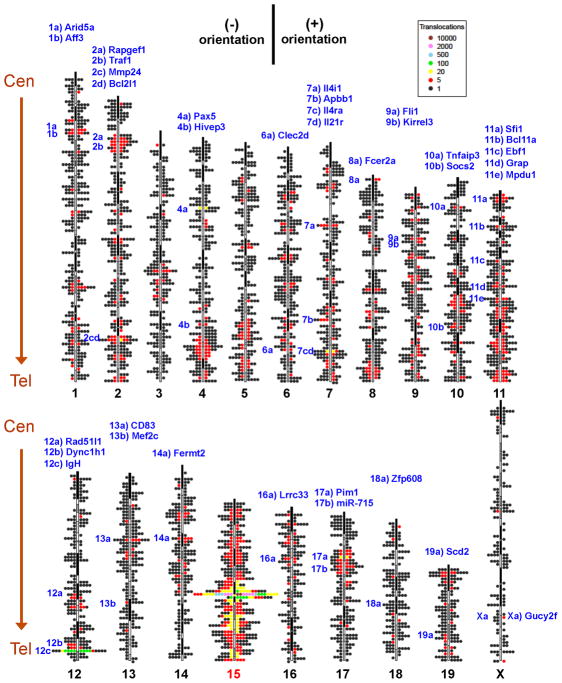
Figure 2. Genome-wide distribution and orientation of translocations from c-myc DSBs.
Genome-wide map of translocations originating from the c-myc25x I-SceI cassette (chr15) in αCD40/IL4-activated and I-SceI-infected B cells. Single junctions are represented by dots located at corresponding chromosomal position. The dot scale is 2 Mb. Clusters of translocations are indicated with color codes, as shown in legend. (+) and (−) orientation junctions (see Fig. S3) are plotted on righ and left side of each ideogram, respectively. Hotspots (see Fig. 4A), are listed in blue on top, with notation on the left side of chromosomes to indicate position. Data are from HTGTS libraries from 7 different mice. Centromere (Cen) and telomere (Tel) positions are indicated. See also Fig. S2.

